
I recently learned about something very interesting known as Benford’s law. This law all started in the year 1085 when William the Conqueror wanted to know how many people lived in his land, and other things about them such as what they owned, what taxes they paid, and how much they made. These results were called the Domesday Book. The conclusion made through this “Book” was that the number one appears the most frequently and then two and so on. This was proven in many different ways.
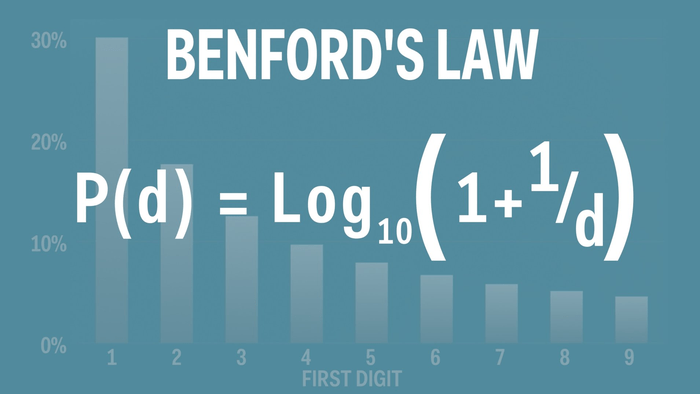
This pattern was first noticed by a Canadian-born American astronomer named Simon Newcomb. In the year 1881, Necomb published a brief note in the American Journal of Mathematics, talking about this pattern. He said that he got this conclusion by observing fraying books of logarithm tables. Here are the results: 1. 30.1%, 2. 17.6%, 3. 12.5%, 4. 9.7%, 5. 7.9%, 6. 6.7%, 7. 5.8%, 8. 5.1%, 9. 4.6%. You can see here that the frequency of the number decreases the higher the number gets. This data did not use the number zero. The reason for this is unknown. This data shows that the number one appears almost seven times more likely than the number nine. Newcomb did not rigorously prove why this happens but rather wrote about it with curiosity. The reason for this was unknown until 1938, when a physicist at the General Electric Company in New York, Frank Benford, rediscovered this paradox. Benford stated that he was unaware of Necomb’s paper.
Unlike Newcomb, Benford looked into more things than just fraying books in logarithm tables, but everything he could get his hands on. Some things that Benford looked into were: US city population tables, addresses of people, atomic weights of elements, tables of the areas of rivers and from expected distribution, and many more. Benford said that this phenomenon must be evidence of a universal law, and named it the Law of Anomalous Numbers. This name did not stick, but it was instead called Benford’s law. In the book, the author talks about a financial investigator who finds corrupt data. This man is named Darrel D. Dorrel and he uses Benford’s law to help him find financial fraud. Many people have used Benford’s law to help them with various things. Scott de Marchi and James. T Hamilton of Duke University used it to follow levels of lead and tantric acid emissions. Walter Mebane, who is a political scientist at the University of Michigan, used Benford’s law as evidence of his suggestion that the Iranian presidential election of 2009 was rigged. Many scientists used Benford’s law as a diagnostic tool. They use it for things such as measuring earthquakes.
Benford also did something that Newcomb did not. He added zero to his data. The new data is as follows: 0. 12% 1. 11.4%, 2. 10.9%, 3. 10.4%, 4. 10%, 5. 9.7%, 6. 9.3%, 7. 9%, 8. 8.8%, 9. 8.5%. There is a simple way to explain how Benford’s law works. If you count from 1 to 20, you will see the pattern. More than half of the digits start with a 1, since 11 to 19 all do. If we continue counting upwards, we will always have passed at least as many numbers that begin with a 1 as start with a 2. If we go to the twenties, two hundreds, or even two thousands, we will have counted through the tens, hundreds, and thousands (This rule also applies to every following number).
If you would like to understand Benford’s Law on a deeper level then read it here:


Leave a comment